A recap of what we know thus far:
- The day-count (I’ve been interchangeably using the word “tenor”) of the option model we use affects the implied volatility we measure.
- Calendar and business-day models are naive in opposite ways.
- Calendar-day models ascribe an equal amount of variance to every day regardless of whether the market is open or not.
- Business-day models ascribe zero weight to weekends and holidays — but to be sure, the true price of an asset can change over the weekend even if the change is not observable until the market re-opens.
- We can assign our own weights to days to specify a custom variance day calendar. This is useful because:
- The implied volatility generated by such a calendar is closer to reality because it deals with how time passes more accurately. Going forward we will call this the “clean” volatility. The implied volatility generated by a naive off-the-shelf 365-day or 251-day model will be called the “dirty” volatility.
- Clean implied vols are useful because we can compare IVs across expiration schedules (if you trade cross-asset this is critical) more confidently because we are using an implied vol that has less artifacts from a naive computation of “time remaining”.
I’ve used repetition to make help you keep your mental luggage intact on this journey. My experience, even with other professionals, is this topic puts people’s brains in a blender. If you are following easily, take some pride in that. If not, that’s baseline. Your recourse is to keep re-reading and build a simple calendar mimicking what I did in Excel. All the steps are trivial even if the concept hurts a bit.
This question is a good litmus test for how well you are following:
Where can you observe this clean volatility number?
You don’t observe it directly because the vendor you are using is not deploying an option calculator that assumes a 279.5-day or any other custom day-count year.
But there’s good news…
You can generate it from any implied volatility reading you pull from your current choice of software. We call this process “cleaning” the volatility and it’s actually very simple.
We’ll start with an example, then generalize the method.
Before we do that, we’ll pause to have a closer look at “time remaining”
Variance Time Until Expiry
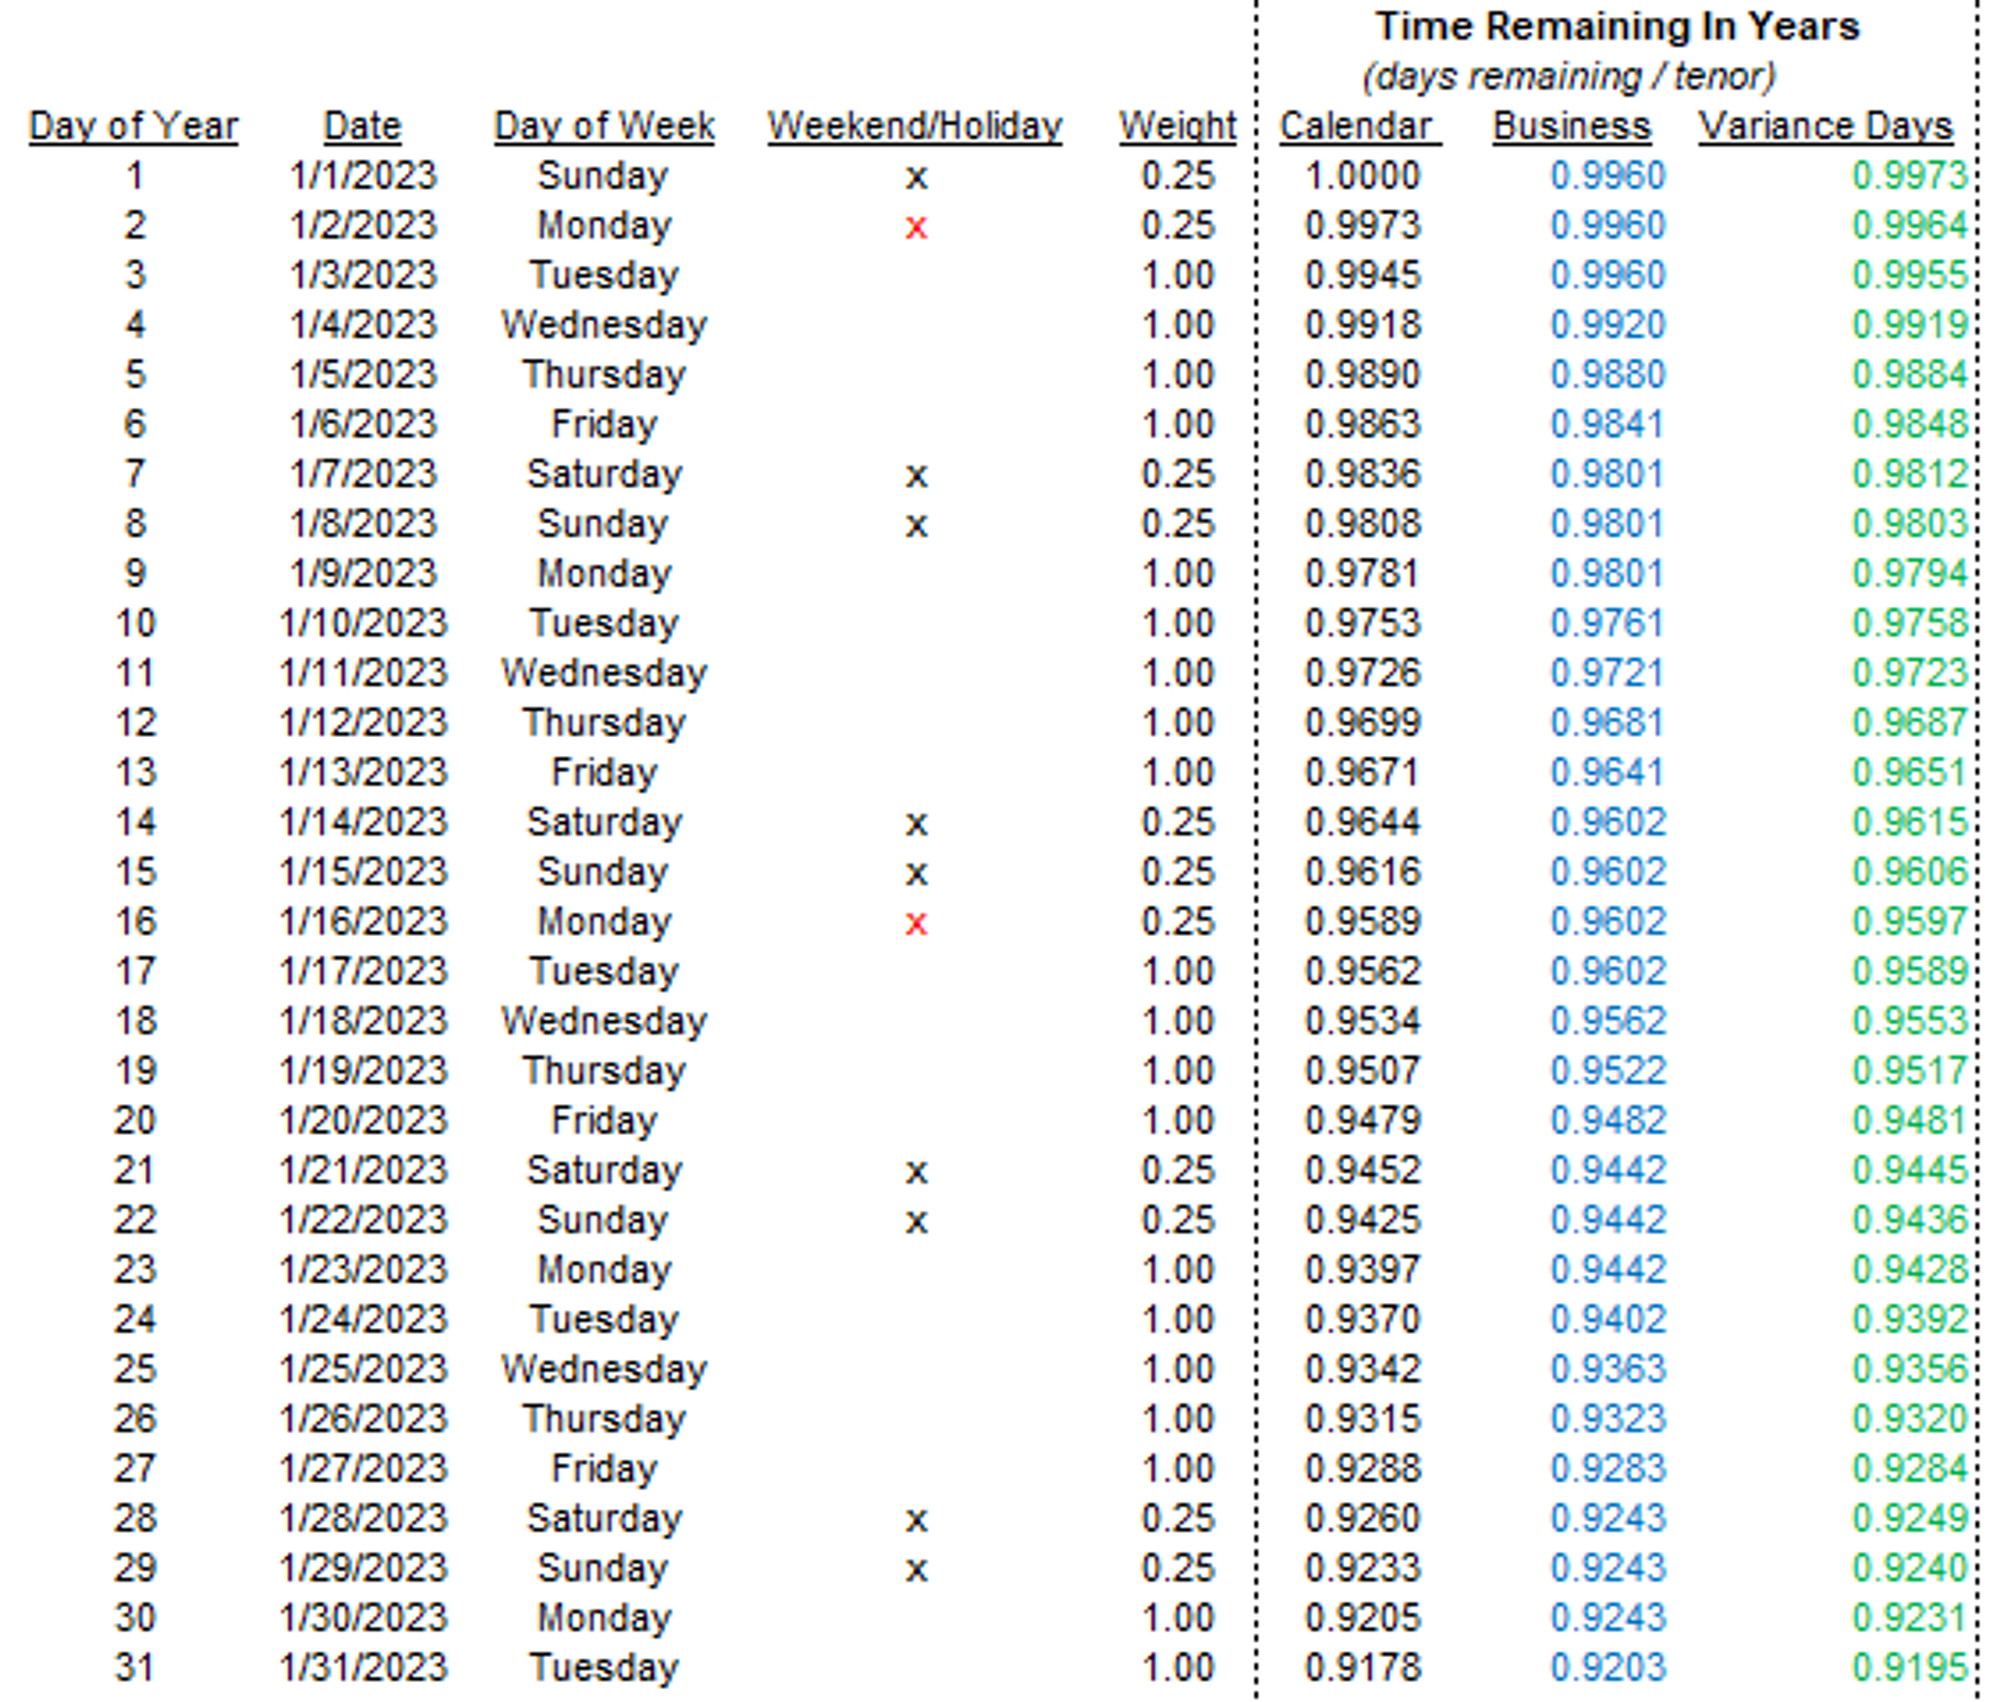
Recall this schedule (I re-shuffled the columns so you focus on “Time Remaining In Years”):

We are looking at trade dates in January for an option that expires on Dec 31st. We can see that all 3 models disagree about the time remaining.
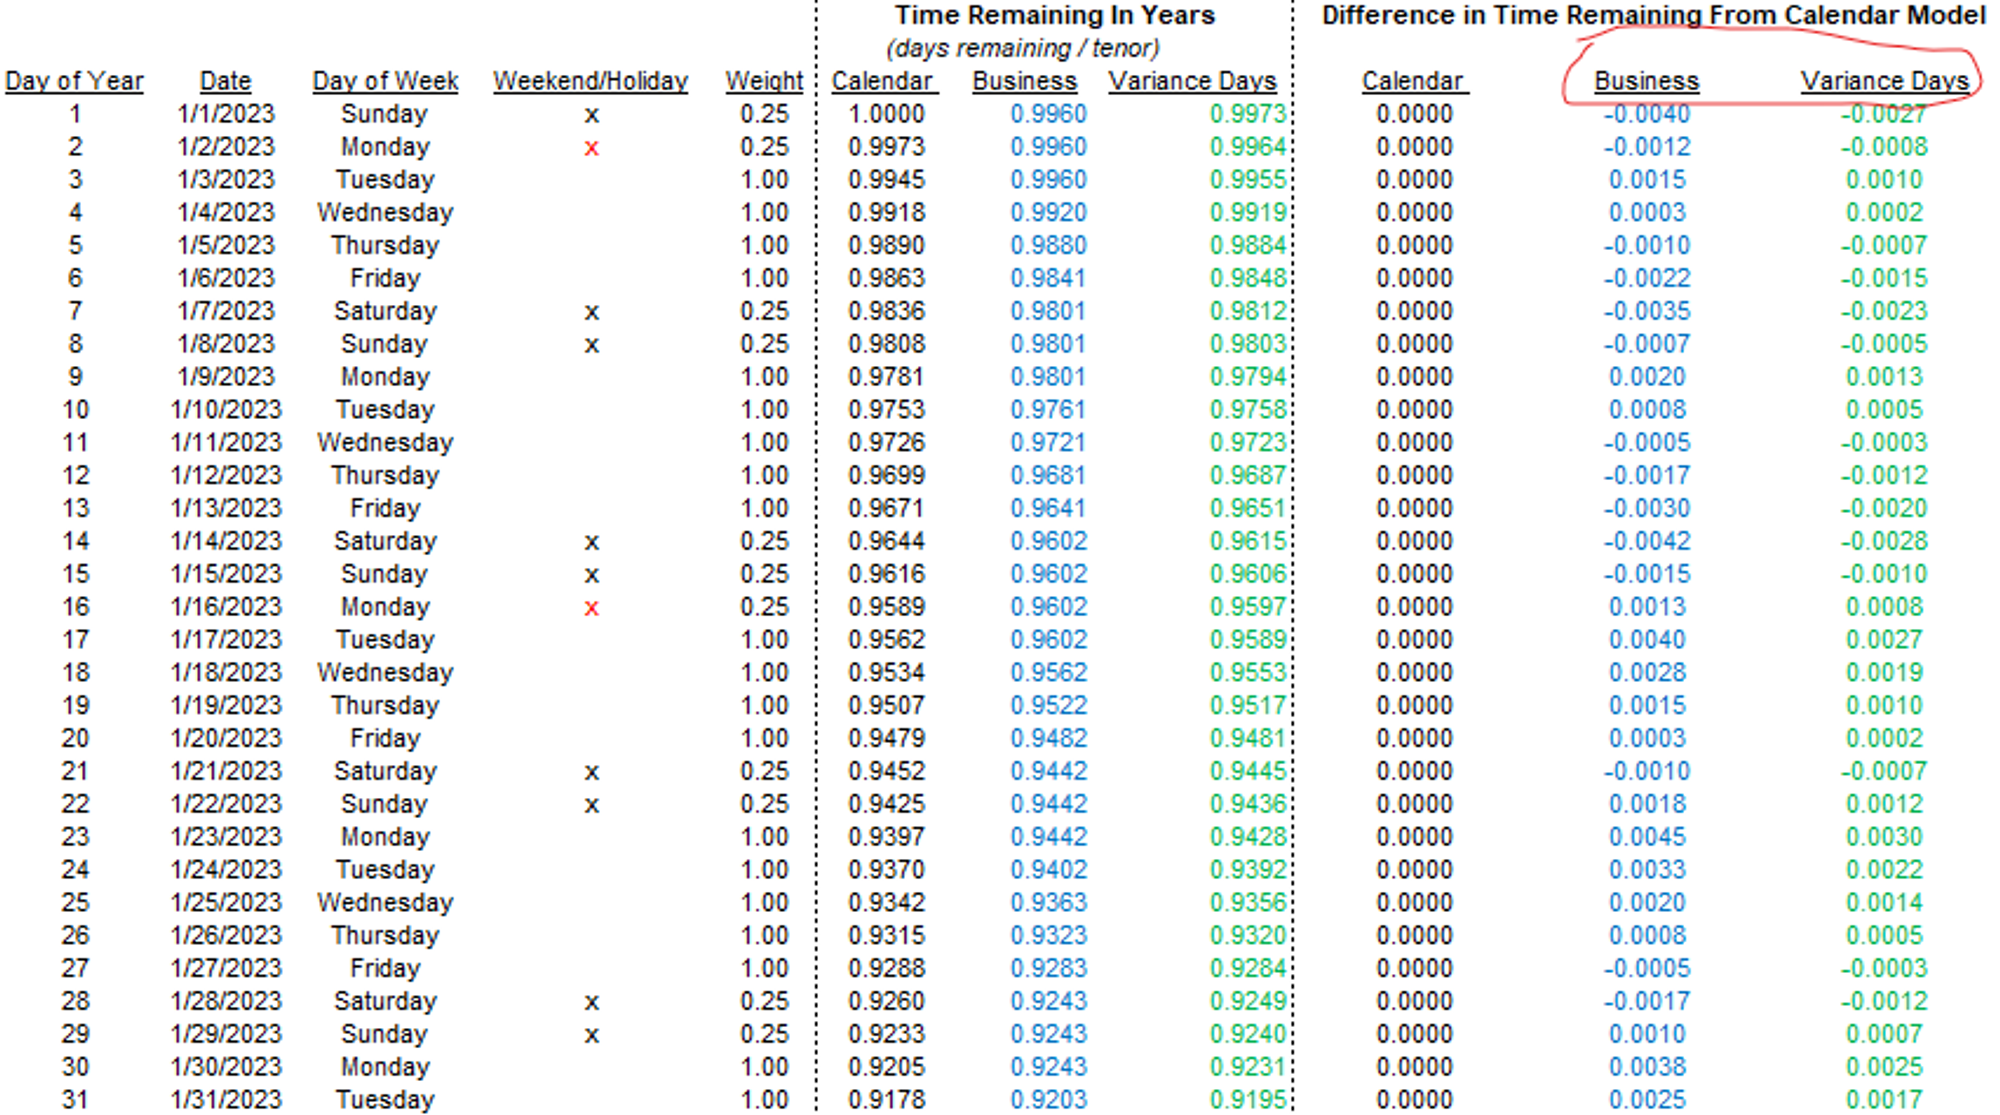
Most off-the-shelf pricing models assume the 365-day calendar. Let’s add a couple of columns that compute the difference in time remaining from the 365-day model for each of the business day model and the variance day model (recall that our clean model assigns non-business days .25 weight):

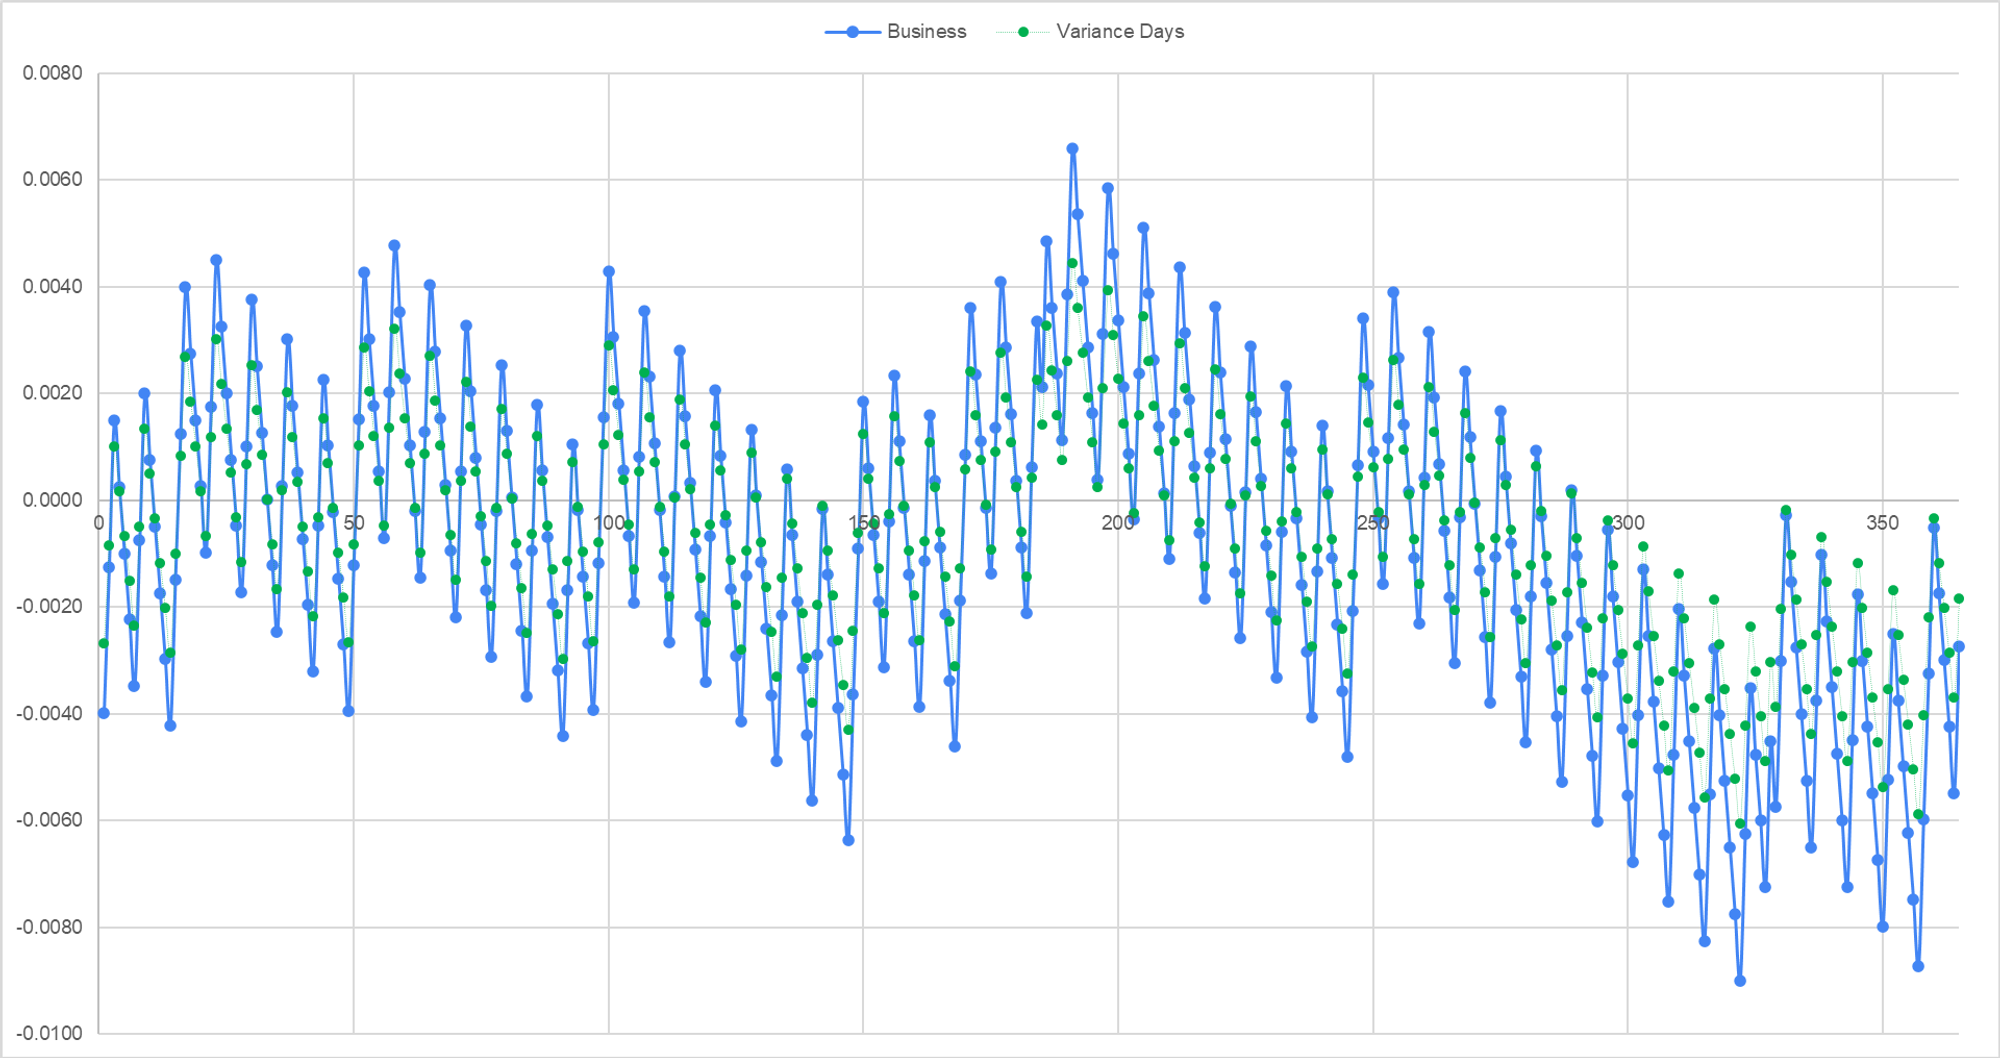
We can plot the diffs as the option approaches expiry from January through December. This is a chart of time remaining til expiration versus a 365-day model.

Notice that the variance day model (ie the clean model) has smaller absolute differences from the calendar day model than the business day model. This makes sense…if a 365-day model is uniformly distributing variance across all days, and the business day model is lumpy because it has no variance on the weekends, then the clean model is blending the approaches.
In the later part of the year, the clean and business day models both show less time to expiration than the calendar day model (which would be represented as the X-axis since it’s a difference chart). This also makes sense…the holidays at the end of the year mean there is less variance time to expiration and this effect becomes stronger proportionally as the option becomes shorter-dated.
This observation takes us to an example that will bootstrap our general process for translating dirty vols into clean ones.
A Short-Dated Option Example
Imagine it’s Monday morning and you are looking at a straddle that expires next Wednesday evening.
Here’s a summary:

Let’s say the straddle is trading for $3.
Using your trusty 365-day Black-Scholes calculator you find this corresponds to an implied vol of 20%
20% is your dirty vol.
What is the clean vol using the variance day model if the dirty vol is 20%?
Solution
The key insight is that for a $3 (or any other price) straddle the total amount of variance implied from now until expiration does not depend on the model you choose.
A model with less time until expiration will imply a higher volatility to conserve total variance. In other words, we have an equality:
Dirty Variance x Dirty DTE = Clean Variance x Clean DTE
Clean variance is the only unknown!
- Don’t forget: variance is just vol squared
- The DTE (days to expiry) we are using is the one that is a fraction of the year because it is normalized (ie divided) by the model’s year-length in days
Plug and chug:
20%² x 2.7397% = Clean Variance x 3.0411%
Clean variance = .0360
Clean volatility = 19%
The dirty vol from your naive 365-day model of 20% cleans up to be 19%!
We can use the inequality to generalize a cleaning ratio:
Clean Variance = Dirty Variance x Dirty DTE / Clean DTE
Cleaning Ratio = Dirty DTE / Clean DTE
Succintly, we multiply a dirty variance by the cleaning ratio to yield a clean vol:
Clean Variance = Dirty Variance x Cleaning Ratio
The solution yields several insights:
- Whether a clean vol is higher or lower than a dirty vol depends on the cleaning ratio. The cleaning ratio is the ratio of Dirty DTE to Clean DTE (again, DTE is a fraction of the year remaining where the year length depends on the model’s day convention)
- The cleaning ratio reflects the proportion of calendar days and business days remaining until expiry. If it is greater than 1 then the clean model has less time to expiry than the dirty model and it is therefore intuitive that the clean vol would be higher than the dirty vol to compensate for less time to expiry. Remember, total variance until expiration is conserved regardless of the tool you use to measure IV.
- If an option expires on December 31st, on January first every model has 1 year until expiry and the IVs will sync up. As soon as time starts to pass, the DTE for each model will diverge.
- We can use the same equality to convert between any 2 models. If some of your traders use a calendar day model and some use a business day model you can translate back and forth so they can communicate in apples-to-apples terms. (I used a calendar day model that I would convert to a variance day model. In oil markets, many people trade Asian options, sometimes called average-price options or APOs. Because those options settle to the arithmetic mean of the daily closes for a given month, traders active in APOs would prefer a business day model since it mapped more closely to the Asian models)
Next section: Demonstrating The Intuition Behind Clean Vols