
Think of the cumulative distribution function of any distribution, for example, the lognormal distribution. It looks something like this:
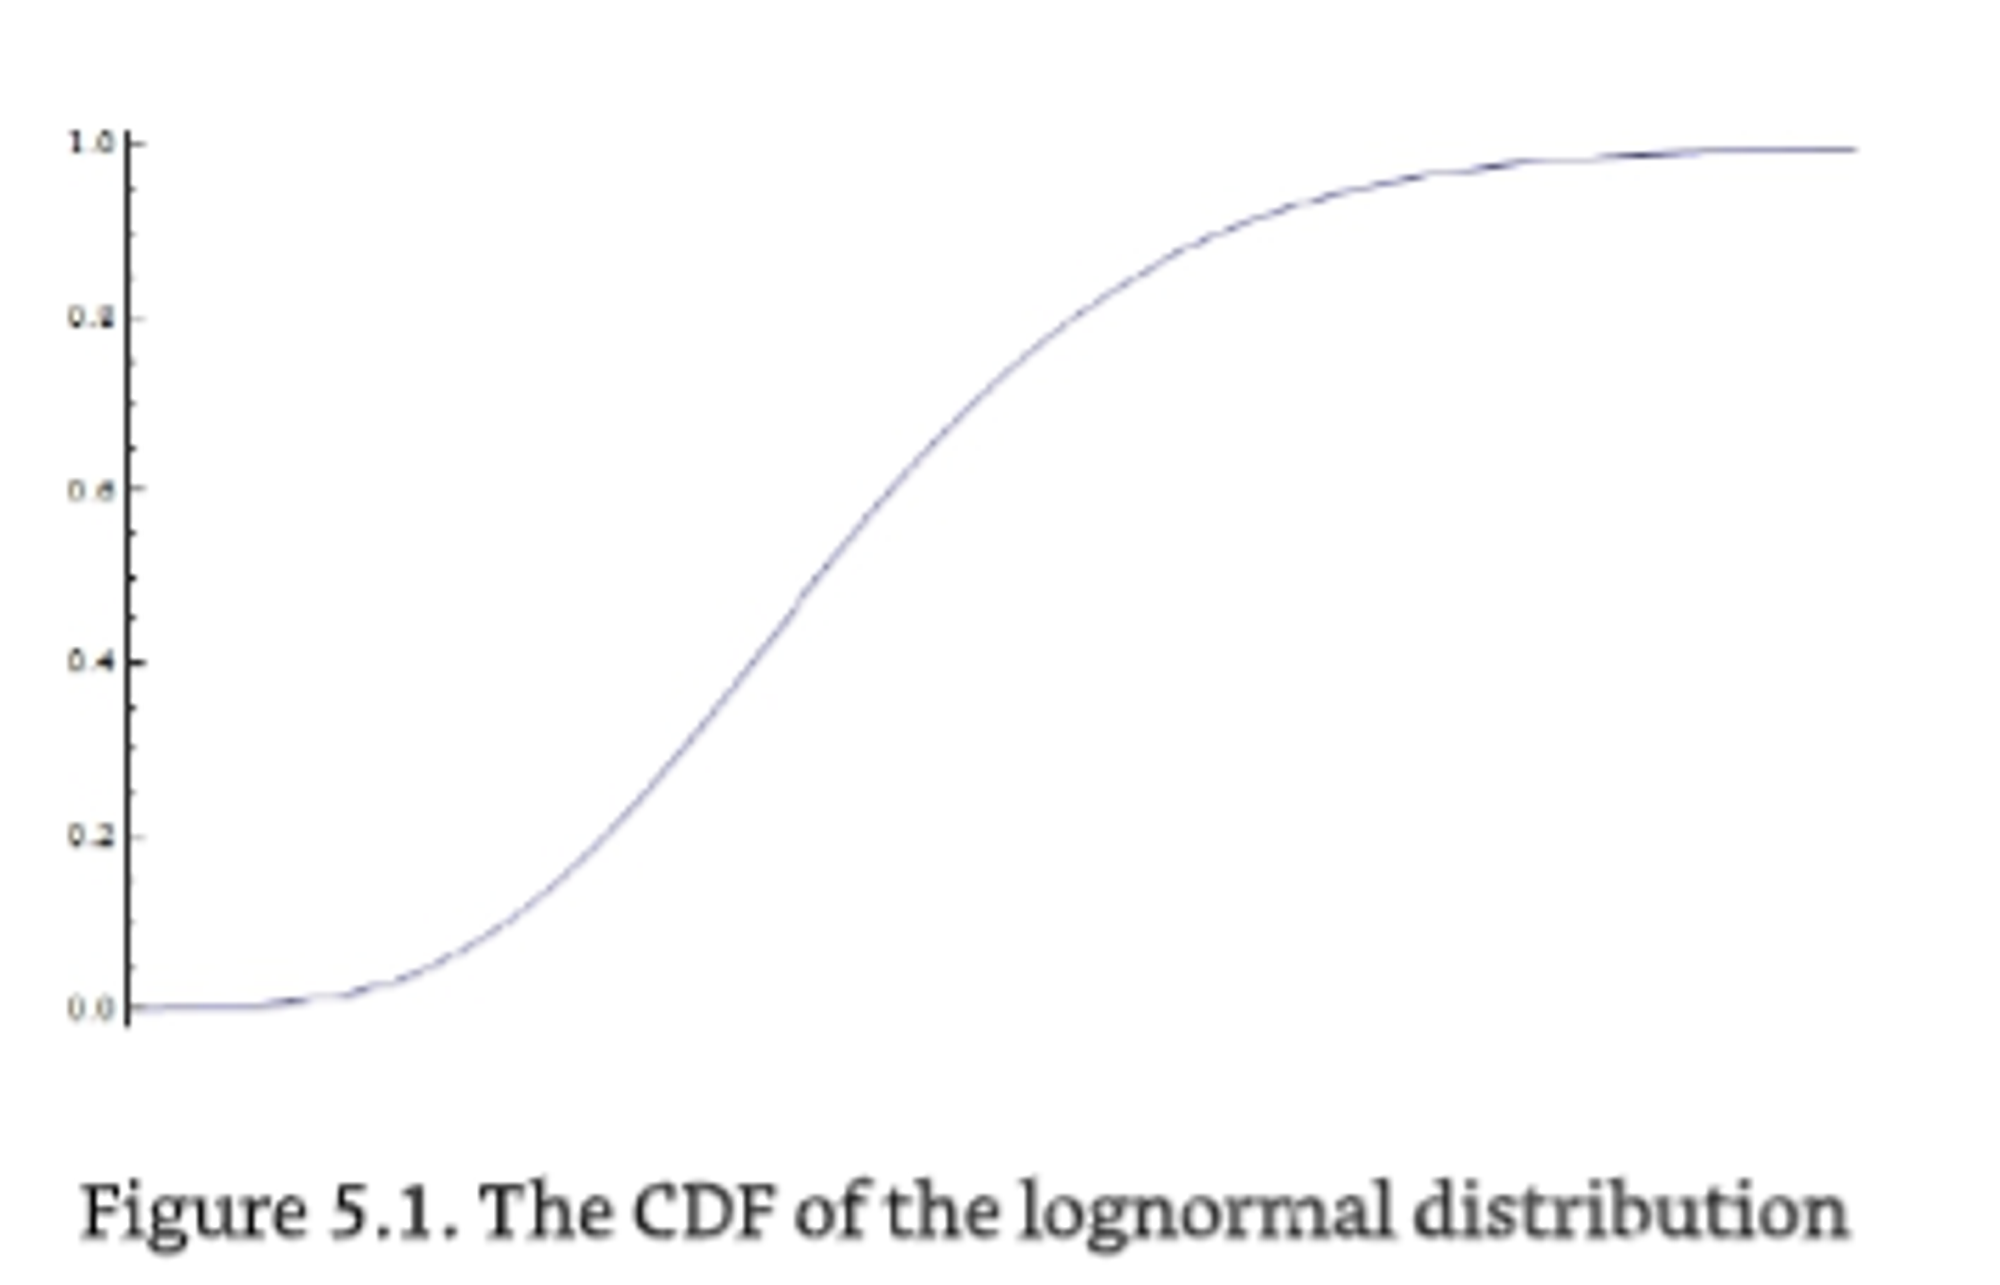
The cumulative probability starts at zero and grows up to one. What we want to get is a random number along the x-axis. But notice two things:
- the y-axis is always between zero and one
- for every y-value, there is a unique corresponding x value
The trick is then to pick a uniformly random number between zero and one as the cumulative probability, and then find the matching x value that generates that probability. In Excel 2010, the formula would look like this:
=LOGNORM.INV(RAND(),0,0.2)
This will generate a random logreturn from a 20% vol distribution
The Excel LOGNORM.INV function
Returns the inverse of the lognormal cumulative distribution function of x, where ln(x) is normally distributed with parameters Mean and Standard_dev. If p = LOGNORM.DIST(x,...) then LOGNORM.INV(p,...) = x.
Use the lognormal distribution to analyze logarithmically transformed data.
LOGNORM.INV(probability, mean, standard_dev)
The LOGNORM.INV function syntax has the following arguments:
- Probability Required. A probability associated with the lognormal distribution.
- Mean Required. The mean of ln(x).
- Standard_dev Required. The standard deviation of ln(x).
To simulate a daily return, we need to scale the volatility down to a single day. The Excel 2010 code for this is:
=LOGNORM.INV(RAND(),0,0.2/SQRT(252))